Beyond Documents
Documents are useful. You've probably been asking for them since Chapter 5 — Word files, PDFs, neatly formatted reports you can send to someone or drop into a folder. And that works well for a lot of tasks.
But there's a whole category of information that a document doesn't serve very well.
If someone sends you three spreadsheets of monthly sales data across different regions and asks "which region is trending down?", the honest answer doesn't live comfortably in a paragraph. It lives in a picture. A chart. Something your eye can absorb in a few seconds and compare at a glance. A two-page report full of numbers makes you do the work the visual should be doing for you.
Or imagine you're staring at a folder full of weekly project update files and you want to know, right now, which projects are behind and which are on track. A document that summarizes each one in prose is technically an answer. It is not, however, a good one. A table you can filter and sort is.
This is the gap this chapter is about. When you delegate a task in Cowork, you are not limited to asking for a document. The output format is a choice you make — and visual, interactive outputs are fully on the table.
Output Format Is Just Another Instruction
Most people don't realise this, because most AI tools only give you one kind of result: text. You ask, they respond, the response is words.
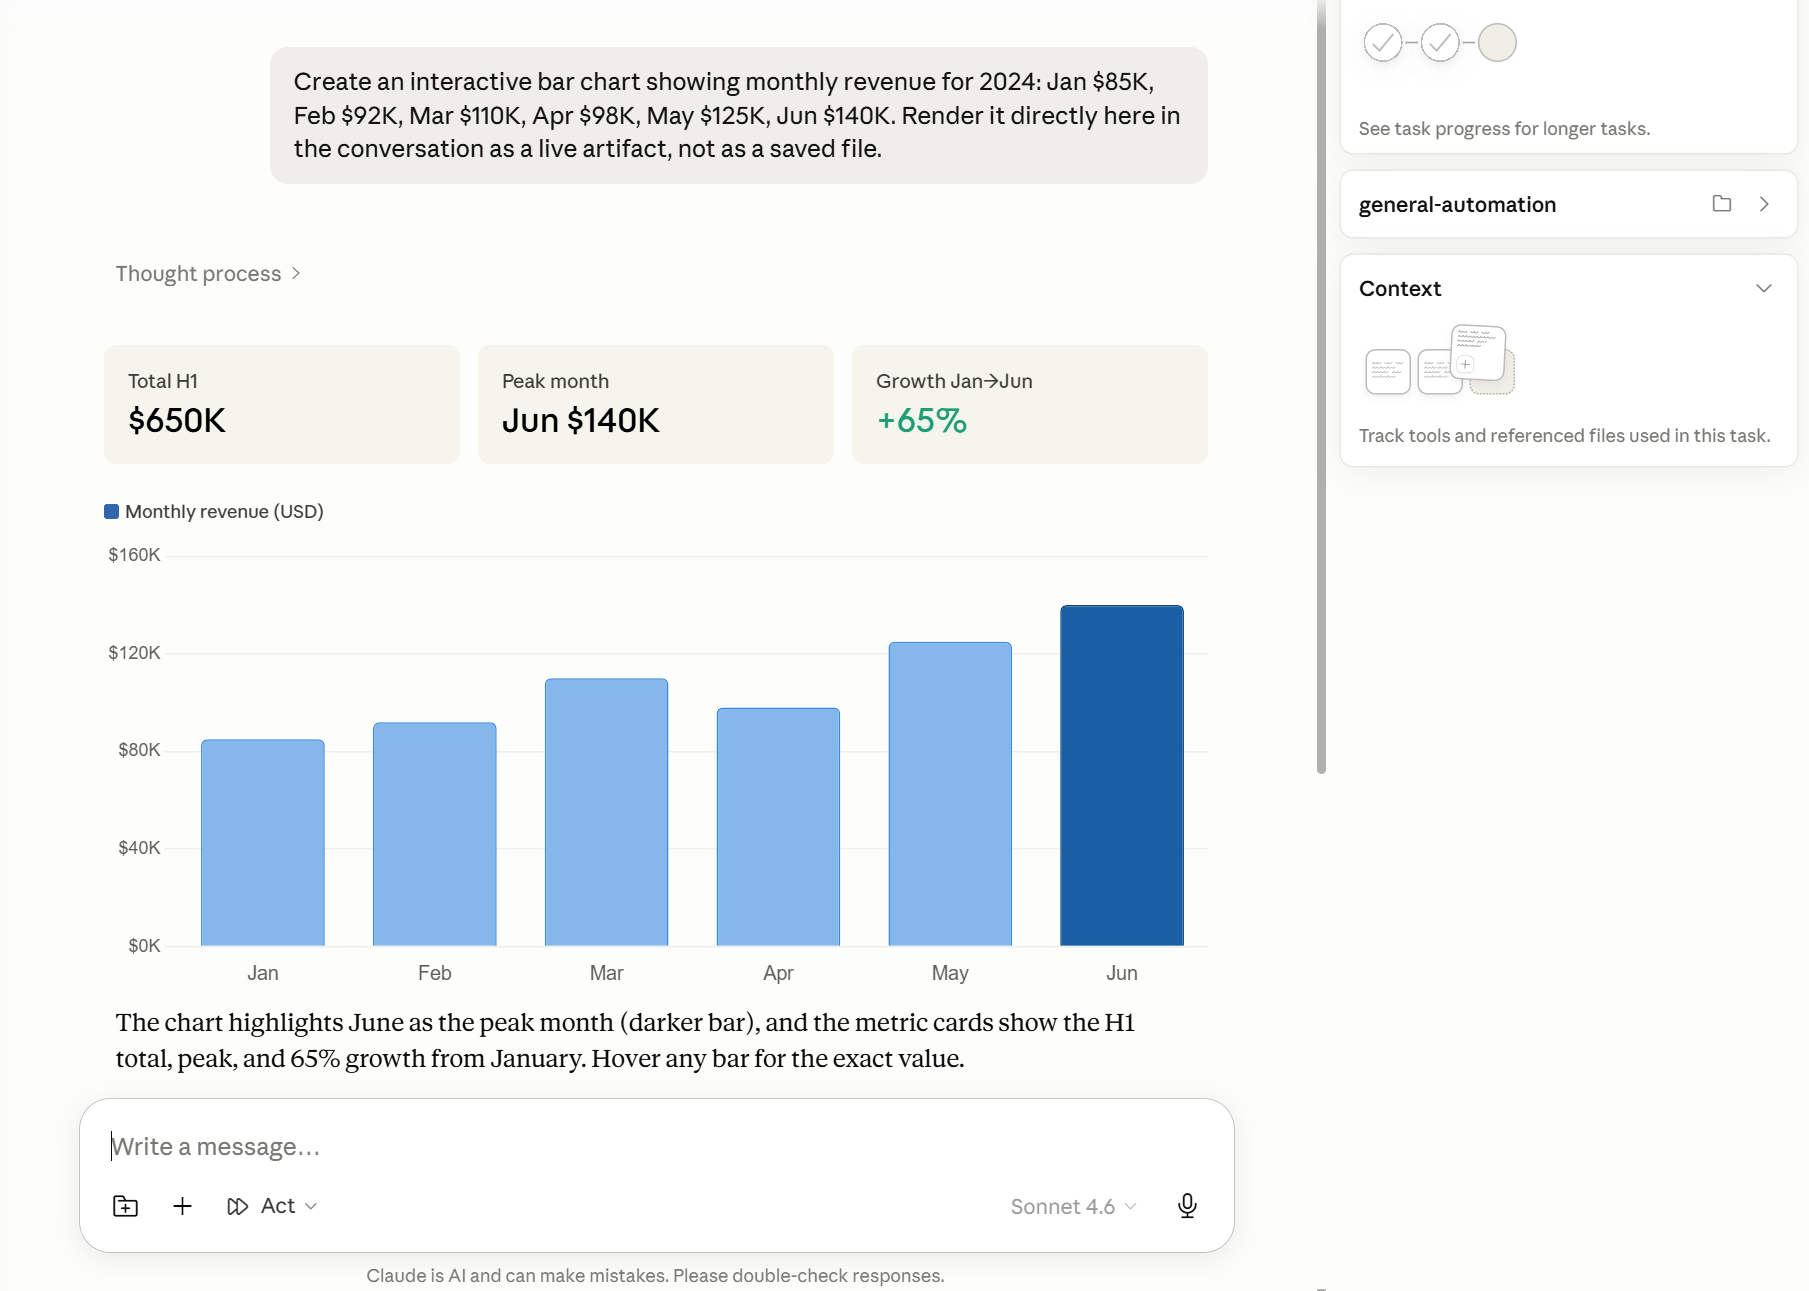
In Cowork, the output format is part of the delegation brief, the same way file location and output filename are. If you say "save it as a Word document", you get a Word document. If you say "show me a chart", you get a chart. If you say "give me an interactive table I can filter by region", that's what gets produced — right there in the task result, on the screen in front of you.
You don't need to understand how it's produced. You don't need any technical knowledge. You describe what you want to see, the same way you'd describe it to a capable colleague. If you'd say "can you just show me a quick bar chart of that?" to a person, you can say exactly that to Cowork.
What You Can Ask For
To make this concrete, here are examples of the kinds of visual outputs you can request as part of a task.
A finance manager looking at three months of department expense reports might say: "Read these three spreadsheets and show me a bar chart comparing department spend by month. I want each department as a separate colour." That's a task brief like any other — source material, output format, a note on what should be visible. The result appears in Cowork when the task completes.
An operations manager with a folder of weekly project status files might say: "Read all the files in my Project Updates folder and produce a summary dashboard showing each project's current status, owner, and whether it's on schedule. I want to be able to filter by owner." Instead of reading a dozen files one by one, they come back to a live, filterable table they can act on immediately.
A marketing coordinator with a survey results file might say: "Take this survey data and turn it into a visual breakdown by region. I want to see how responses to the main question varied across our five territories." Instead of reading rows of numbers, they get a clear visual comparison.
In each case, the person asking isn't describing how the output should be built — they're describing what they want to see. That's the whole job.
Where These Outputs Live
There's one thing worth being clear about, because it surprises some people the first time they encounter it.
Visual and interactive outputs appear directly in Cowork, inside the task result. They are not saved to your files. You will see the chart, the table, or the dashboard on your screen when the task finishes, but there is no file sitting in a folder anywhere. If you close the task, the output goes with it.
This is actually fine for most uses. If you're exploring data, checking something quickly, or showing a result to someone who's sitting with you, an output that lives in Cowork is exactly what you need. It's fast, it's immediate, and you don't end up with a folder full of one-off charts from every task you've ever run.
If you do want a permanent version — something you can attach to an email, include in a report, or send to a colleague — just ask for that specifically. You can say "and save a static version as image" or "export this as a PDF" and Cowork will save that file to whichever folder you specify. The visual in Cowork and the saved file are different things; you can have both, but you have to ask for both.
The key mental model is: Cowork is the screen where you see results, and your folders are where you keep things. By default, visual outputs stay on the screen. Files stay in folders.
A Note on What's Ahead
Everything in this chapter has been about output format. You have a task, you have source material, and instead of asking for a document you ask for a chart or a table. That's the idea — clean, contained, useful.
But the same underlying capability that lets Cowork build a chart on the fly for a single task can also be turned in a different direction entirely. Instead of producing something you look at once, you can use it to build something that runs on its own — a tool that refreshes automatically, a local dashboard that pulls from live data, an automation that runs on a schedule without you having to trigger it each time.
That's an advanced capability covered later in this guide. For now, the important thing to understand is that requesting a visual output in a task is the simplest version of something with a much wider range. You're not at the edges of what's possible here. You're at the entry point.
Find one file you've looked at in the last week that contains data of any kind — a spreadsheet, a report with numbers in it, a table in a document, even an export from a tool your team uses. It doesn't need to be large or particularly interesting.
Open a new task in Cowork and write a brief that asks for a visual output instead of a document. Describe what you'd like to see — a chart comparing two things, a breakdown by category, a table you can sort — and point to the file. Keep it simple. The goal isn't to produce something polished; it's to experience asking for this kind of output and seeing what comes back.
When the task finishes, notice that the result appears directly in Cowork rather than showing up as a file. If you want a saved version, add one sentence at the end of your brief asking for it.